Year 4 Science · AC9S4I04

Tables, Column Graphs and Scientific Models

Read the evidence, show your working and explain what the record can tell us.

Ready to project and teach

Learning goalsSay it simply

Construct and use tables, simple column graphs, maps and visual or physical models to organise observations, show relationships and identify patterns. Keep the data accurate and explain what each representation shows and leaves out.

Success looks like

  • I build a labelled table that preserves each category and value.
  • I construct a simple column graph with a zero baseline, equal scale intervals and correct heights.
  • I make or use a map, force-arrow model and food-chain simulation for a clear scientific purpose.
  • I describe a pattern using the data and avoid claims beyond the model or investigation.
Clean visual examplesOne-page board

Move from observations to table and graph

SurfaceDistance (cm)
Tile60
Card40
Fabric20
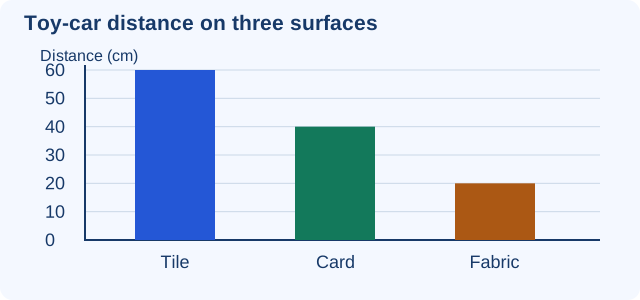
Column graph: Tile 60, Card 40, Fabric 20. Vertical axis is Distance (cm), starting at zero in equal steps of 10.
Original classroom model; use the labels and scale shown.
  1. Organise the original values in a table. Keep surface names attached to their distances.
  2. Put surface categories along the horizontal axis and Distance (cm) on the vertical axis.
  3. Choose a zero-to-sixty scale in equal ten-centimetre steps. Draw equal-width, separated columns to 60, 40 and 20 cm.
  4. Check every height against the table. Being in the right order is not enough.
  5. Describe the comparison: the car travelled 60 cm on tile and 20 cm on fabric, so tile travel was 40 cm farther in this test.

Teacher asks: Where does the card column end? Expected: At 40 cm, four ten-centimetre steps above zero. If incorrect, trace the top of the column to the labelled scale.

This classroom dataset illustrates a surface comparison. Do not claim every rough surface always produces the same distance; interpret the conditions actually tested.

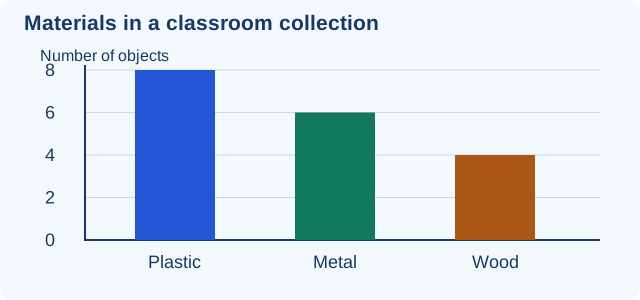
Compare material counts on a different scale

Column graph: Plastic 8, Metal 6, Wood 4. Vertical axis is Number of objects, starting at zero in equal steps of 2.
Original classroom model; use the labels and scale shown.

The scale increases by two objects per step. Plastic is 8, metal is 6 and wood is 4. A six-object column is three steps high. Counts name what was counted; they do not need a length or volume unit.

Construct it: Make a table first, then draw the same values on paper with a title, category labels and a zero-to-eight scale in twos. Agree a rule for mixed-material objects, such as classifying by main material, before counting.

Locate water sources and show force direction

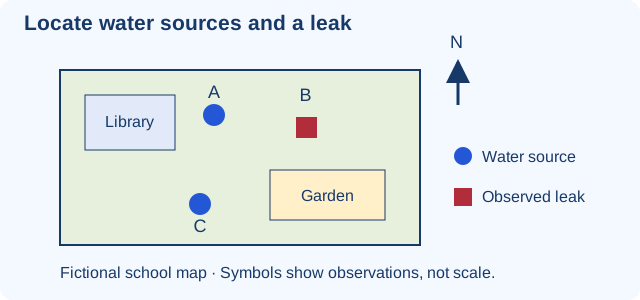
Fictional school map with north up. Library at upper left and garden at lower right. A blue water-source circle A is east of library; blue water-source circle C is west of garden. Red observed-leak square B is north of garden. Key labels blue circle Water source and red square Observed leak.
Original classroom model; use the labels and scale shown.

Read the key before interpreting the map. Blue circles are water sources; the red square is a leak recorded in the fictional survey. With north up, source C is west of the garden, and leak B is north of it. The map shows relative locations but has no distance scale, so it cannot give exact walking distances.

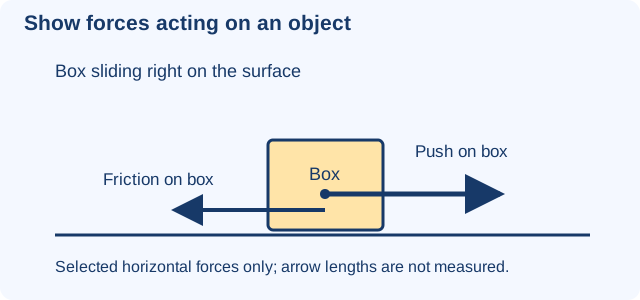
A box slides right on a horizontal surface. An arrow starting on the box points right labelled Push on box. Another arrow starts on the box and points left labelled Friction on box. Only horizontal forces are shown; arrow lengths are not measured.
Original classroom model; use the labels and scale shown.

The box is sliding right. The push arrow begins on the box receiving the force and points right; surface friction on the box points left, opposing that sliding. These are selected horizontal forces. The drawing does not measure force size or show every force on the box.

Explore a food chain with a physical model

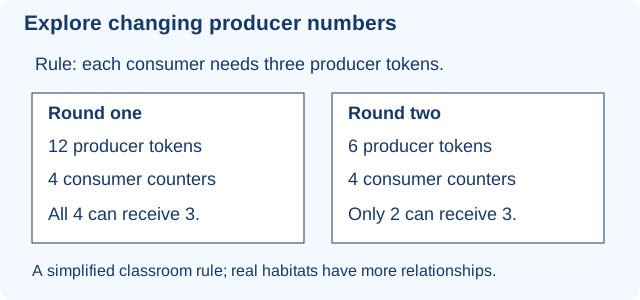
Two rounds of a classroom food-chain simulation. Each consumer needs three producer tokens. Round one has twelve producer tokens and four consumers: four can be fed. Round two has six producer tokens and four consumers: two can be fed. This is a simplified rule, not a prediction of exact real populations.
Original classroom model; use the labels and scale shown.

Use paper plant tokens and consumer counters. The rule is three plant tokens for each consumer. Feed as many consumers as possible, giving each all three tokens. First use twelve tokens and four consumers: all four can be fed. Then keep four consumers but reduce the supply to six tokens: only two can receive three tokens each.

RoundProducer tokensConsumer countersConsumers fully fed
One1244
Two642

Relationship: Fewer producer tokens can support fewer consumers under this rule. Limit: Real animals may have several food sources and many other habitat relationships. The counters do not predict exact future animal numbers.

Try another comparison: Keep twelve tokens and the same rule, then add consumers. Record both starting numbers and how many are fed; do not silently change the rules.

Curriculum examplesCopied content

Content description: construct and use representations, including tables, simple column graphs and visual or physical models, to organise data and information, show simple relationships and identify patterns

E1: using virtual or role-play food chain simulations to explore effects of changing numbers of producers or consumers in a habitat

Run the paper-token model above as a role-play or teacher-controlled virtual model. Students change producer supply while keeping the feeding rule and consumer count fixed, then compare changing consumers with a fixed supply. Construct a results table and discuss the number fully fed.

Modelled example: Twelve producer tokens feed four consumers at three tokens each; six tokens feed only two under the same rule. This demonstrates a simplified relationship, not an exact prediction for a real habitat.

E2: using maps to locate water sources in the local area, or constructing maps to show sites of water wastage in the school grounds

Read the fictional school map and its key, then construct a new map with familiar landmarks, water-source symbols, observed-leak symbols and a north arrow. A teacher-led survey may supply dated observations; a fictional plan or teacher-provided record is equally suitable.

Modelled example: Source C lies west of the garden and the recorded leak B lies north of it. Do not infer an exact distance without a scale or mark unobserved leaks at every source.

E3: constructing column graphs to compare numbers of objects made of particular materials or distances moved by objects experiencing frictional forces

Use both original datasets above. Students construct tables and their own graphs, label axes and units where required, choose equal scale steps and check every column. Use small whole-number counts and distances, without calculating averages.

Modelled example: Surface distances are 60, 40 and 20 cm on a scale in tens; material counts are 8, 6 and 4 on a scale in twos. A correct graph must preserve the exact values, not just tallest-to-shortest order.

E4: using force arrows to show forces operating on objects

Construct force-arrow drawings with the arrow starting on the object receiving the force and pointing in the force direction. Show a push and opposing surface friction on a sliding box, then magnetic attraction on a paperclip towards a nearby magnet. Label the force and discuss selected omissions.

Modelled example: For a box sliding right while pushed right, push points right and friction points left. A paperclip to the left of an attracting magnet has a magnetic-force arrow pointing right towards the magnet. No vector arithmetic or numerical force sizes are required.

1. Build and audit a graph

Provide the material-count table without a finished graph. Students build a title, labels and equal-step scale, then draw all three columns. A partner checks each category and value against the source before the pair writes a comparison.

Checkpoint: Six objects on a scale in twos requires three steps. If the learner draws six steps, reconnect each step with its value before continuing.

2. Use and construct a map

Students first read the water-source key and locate C relative to the garden. They then draw a fictional school map with two sources and one recorded leak, label a key and give a correct location statement. A teacher-provided local map can extend the same work.

Look for: Meaningful symbols in real positions on the drawing, not just a list of place names. Ask what cannot be determined without a distance scale.

3. Model, change and explain

Use counters to run two food-chain rounds under a stated rule. Construct a results table and compare the number of consumers fed. Separately draw a force model for a box sliding left; show friction acting right on that box.

Teacher check: The model input change is recorded, conclusions respect the rules, and the force arrow starts on the receiving object. If a learner draws arrows only between labels, ask “which object feels this force?” and redraw on that object.
Questions and answersWith answers

Important questions and answers

  • When is a table useful? When exact labelled values must be organised and kept for later checking.
  • What makes a column graph accurate? A suitable common scale, correct labels and units when needed, and every height matching the source value.
  • Do counts need centimetres or millilitres? No. Label them Number of objects or another named count. Measured distances need a length unit.
  • What do force arrows mean? They show the direction of a named force acting on the object where the arrow starts. They are not automatically motion arrows.
  • What can a token model tell us? It explores a relationship under stated rules. It does not contain every real feeding link or predict exact wild populations.
  • What does a map key do? It explains the meaning of each symbol so locations can be interpreted correctly.
Practice and reviewReady for practice

Assessment-style questions and review hints

  • A material count is six and the graph scale is two per step. How high is the column? Answer: Three steps above zero. Review: Count in twos, not ones.
  • A map gives water-source locations but no distance scale. Can it show the exact metres between sources? Answer: No; it shows relative locations only.
  • A box slides left on a surface. Draw friction acting on the box. Answer: An arrow beginning on the box, pointing right and labelled friction.

Exit ticket

Construct a table and small column graph for three teacher-provided counts. Add a title, labels and equal intervals, then write a value-based comparison. Choose a map, food-chain or force model and state one relationship it shows and one detail it leaves out. Mastery evidence: Correct values and heights, meaningful labels, and a model-specific relationship and limit. Reteach the relevant worked example if any part is missing.

Common misconceptions and corrections

  • The order of the columns is enough. Every column must reach the exact recorded value on the same scale.
  • Every graph step is one. Read the scale labels; a step might represent two objects or ten centimetres.
  • Equal counts can have different heights on one scale. The same value has the same height.
  • A model is a complete copy. Name the particular relationship and the details omitted.
  • A force arrow always points along motion. Friction on a sliding box opposes that sliding. Label the force and receiving object.
  • A map gives exact distances automatically. A distance scale is needed; a key explains symbols, not metres.

Support, Core and Extend

  • Support: Supply labelled axes or a partly headed table, simple counts and physical counters; still require the learner to place the values.
  • Core: Construct complete tables and graphs, maps with keys and labelled force models; compare two simulation rounds.
  • Extend: Choose a different sensible equal-step scale, compare a changed consumer count, or improve a model with a useful label and a clear limitation.

Year 4 boundary: Use simple column graphs, whole-number counts or familiar measured values and qualitative force directions. Formal averages, broken graph scales, vector calculations and population equations are not required.

Curriculum alignmentStart here

Students choose representations for a purpose, transfer data accurately from records to tables or graphs, use labelled scales and explain what a model shows as well as what it simplifies.

Learning routine: Observe → Model → Investigate → Record → Explain → Evaluate

Success looks like

  • Choose suitable representations
  • Construct accurate tables/graphs
  • Use consistent labels/scales
  • Interpret patterns
  • Evaluate model limitations
Teach & ExplainTeaching slides and samples

Teach this topic step by step

Explore optional teaching slide packs for classroom lessons and explanations at home.

Browse Teach & Explain · Browse Print & Go

Teachers: follow SkillrHub on TPT, then email us to request a free sample before buying. Include the year, subject and topic or curriculum code.

Request a free sample

After trying the sample, honest feedback is welcome. A TPT review is optional, where available, and does not need to be positive.