Content description: construct and use representations, including tables, simple column graphs and visual or physical models, to organise data and information, show simple relationships and identify patterns
E1: using virtual or role-play food chain simulations to explore effects of changing numbers of producers or consumers in a habitat
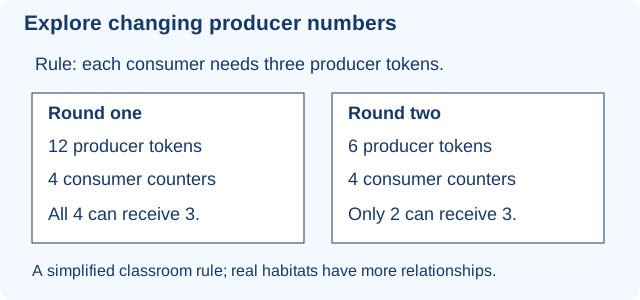
Run the paper-token model above as a role-play or teacher-controlled virtual model. Students change producer supply while keeping the feeding rule and consumer count fixed, then compare changing consumers with a fixed supply. Construct a results table and discuss the number fully fed.
Modelled example: Twelve producer tokens feed four consumers at three tokens each; six tokens feed only two under the same rule. This demonstrates a simplified relationship, not an exact prediction for a real habitat.
E2: using maps to locate water sources in the local area, or constructing maps to show sites of water wastage in the school grounds
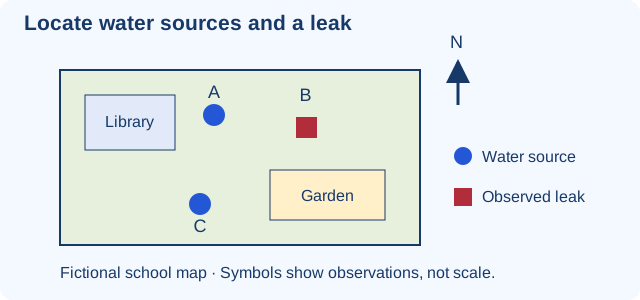
Read the fictional school map and its key, then construct a new map with familiar landmarks, water-source symbols, observed-leak symbols and a north arrow. A teacher-led survey may supply dated observations; a fictional plan or teacher-provided record is equally suitable.
Modelled example: Source C lies west of the garden and the recorded leak B lies north of it. Do not infer an exact distance without a scale or mark unobserved leaks at every source.
E3: constructing column graphs to compare numbers of objects made of particular materials or distances moved by objects experiencing frictional forces
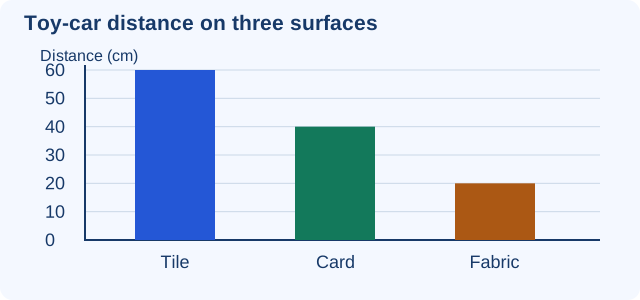
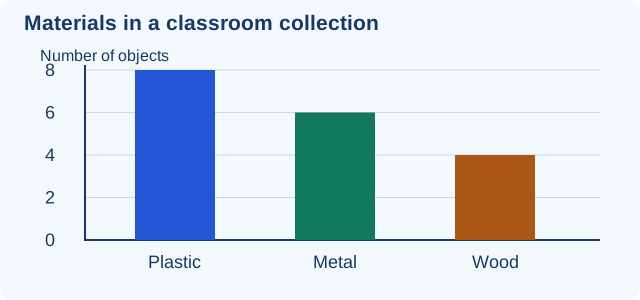
Use both original datasets above. Students construct tables and their own graphs, label axes and units where required, choose equal scale steps and check every column. Use small whole-number counts and distances, without calculating averages.
Modelled example: Surface distances are 60, 40 and 20 cm on a scale in tens; material counts are 8, 6 and 4 on a scale in twos. A correct graph must preserve the exact values, not just tallest-to-shortest order.
E4: using force arrows to show forces operating on objects
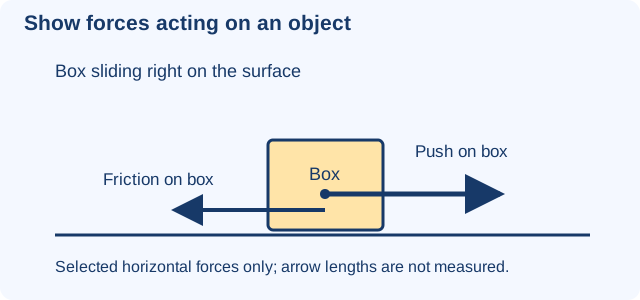
Construct force-arrow drawings with the arrow starting on the object receiving the force and pointing in the force direction. Show a push and opposing surface friction on a sliding box, then magnetic attraction on a paperclip towards a nearby magnet. Label the force and discuss selected omissions.
Modelled example: For a box sliding right while pushed right, push points right and friction points left. A paperclip to the left of an attracting magnet has a magnetic-force arrow pointing right towards the magnet. No vector arithmetic or numerical force sizes are required.