Examine how people use data to develop scientific explanations
Students distinguish measurements from opinions, identify patterns across data and build explanations in which a claim is supported by relevant evidence and reasoning…
Ready to project and teach
Learning goalsSay it simply
Students distinguish measurements from opinions, identify patterns across data and build explanations in which a claim is supported by relevant evidence and reasoning rather than a single preferred result.
Learning routine: Observe → Model → Investigate → Record → Explain → Evaluate
Success looks like
Identify valid data
Describe patterns
Construct CER explanations
Evaluate fairness and limitations
Revise explanations with evidence
Clean visual examplesOne-page board
Clean one-page examples
AC9S4H01 - Examine how people use data to develop scientific explanations
1. Evidence sort Sort statements into claim, evidence, reasoning or opinion and explain borderline cases. claim Dark material warmed faster evidence 44°C after 6 min reasoning same-time comparison opinion black looks better
Example 3
2. Graph-to-explanation Use a simple graph to write one cautious claim, cite two values and explain the pattern. read axes → identify pattern → state claim → cite values → explain limitation
Example 4
3. Conflicting data review Compare two groups’ results, check methods and decide whether to combine, repeat or revise the explanation. group result method check A 44°C same volume B 40°C different starting temp
Curriculum examplesCopied content
The content description and elaborations below show the curriculum ideas taught in this unit. Items marked as teaching context support lesson planning.
Content description: examine how people use data to develop scientific explanations
E1: examining age-appropriate scientific journal articles, identifying common text features and exploring why the scientific community might have conventions for sharing information about data and explanations
E2: viewing or listening to documentaries or news reports that feature researchers and identifying how they talk about their area of research, particularly references to observations, data and evidence
E3: investigating how ecologists use food chain data to develop explanations for population decline of native species such as the Richmond birdwing butterfly, and to develop strategies to increase their population
E4: explore how hydrologists use rainfall and water use data to explain the amount of water flowing in rivers and why this changes over time
E5: investigating how First Nations Australians test predictions and gather data in the development of technologies and processes (teaching context)
Questions and answersWith answers
Core idea: Students distinguish measurements from opinions, identify patterns across data and build explanations in which a claim is supported by relevant evidence and reasoning rather than a single preferred result.
Remember
Identify valid data
Describe patterns
Construct CER explanations
Evaluate fairness and limitations
Revise explanations with evidence
Use the Important questions and answers and Exit ticket sections for worked responses and evidence checks.
Practice and reviewReady for practice
Any number counts as evidence — Evidence must be relevant to the question and comparison.
One result proves a universal rule — Use cautious language and repeated evidence.
Explanation is just a graph description — Reasoning must connect the observed pattern to the claim.
Conflicting data is deleted — Investigate method, variation and uncertainty.
Read the topic guide and use the teacher slide for instruction. Students can then use the worksheet for written work, open Practice for supported feedback, or take the Test when they are ready.
Curriculum alignmentStart here
Students distinguish measurements from opinions, identify patterns across data and build explanations in which a claim is supported by relevant evidence and reasoning rather than a single preferred result.
Learning routine: Observe → Model → Investigate → Record → Explain → Evaluate
Reading a scientific article (E1)Evidence and explanation
Scientists make their evidence available so other people can check and build on an explanation. Common features include a question, authors, descriptions of methods, results, labelled figures with captions, conclusions and references. Not every article uses the same headings, but readers should be able to find what was done and what supports the explanation.
With a teacher, open Hall and colleagues: Bacteria Can Unlock an Essential Nutrient for Plants, Frontiers for Young Minds (2022). For this Year 4 task, examine the structure rather than the advanced chemistry: locate Figure 1 and its caption, a paragraph describing a comparison, the glossary and the original-source reference. Explain how each helps readers understand or check the report. The detailed chemistry is not required learning.
Worked example: A method tells how a measurement was collected; a results figure displays evidence; a conclusion explains what the evidence suggests. A reference lets a reader trace earlier research. A neat graph or a scientist’s name alone does not prove a claim.
Listening for evidence in research reports (E2)Evidence and explanation
In a teacher-selected researcher documentary or science news report, note the title, speaker and where you found it. Listen for what was observed, how records were collected and which explanation is offered. Pause to distinguish an observation from a prediction or interpretation. Record any measurement with its units and time; do not invent values that the speaker did not give.
The Queensland Government Richmond birdwing page links its Back from the Brink documentary. Use a short teacher-previewed segment and record the evidence actually discussed. Availability of a linked video is not evidence that a particular claim has been made in it.
Invented classroom interview, not a real quotation: A researcher reports 14 nesting birds this season and 9 last season, using the same search method. The counts are data. Saying the population may have increased is an interpretation; more seasons and a check of conditions would strengthen it. Ask: What dates and methods support the comparison?
Ecologists connect food data and population change (E3)Evidence and explanation
The Richmond birdwing’s caterpillars depend on suitable native food vines. Queensland conservation information identifies habitat loss and the introduced Dutchman’s pipe as threats; its leaves can kill larvae that eat them. Ecologists and conservation partners map butterflies and food vines and use such information to guide protection, appropriate planting and removal of harmful vines.
Worked explanation: If comparable surveys find fewer suitable food vines and fewer caterpillars, reduced food availability is one explanation to investigate. Check search effort, season, weather and other threats before calling it the only cause. After a restoration action, keep comparable records to examine whether the pattern changes. Students should not handle wildlife or remove unidentified plants.
Check: Does one photograph prove the entire population is increasing? Answer: No. It records one observation; repeated, comparable surveys provide stronger evidence.
Hydrologists connect rainfall, water use and river flow (E4)Evidence and explanation
Hydrologists study water. They compare rainfall and river-flow records across time, alongside water taken for use, storage releases and other relevant conditions. More rain can lead to greater flow after a delay, but rain is not the only influence. A rainfall amount is not the same quantity as a river-flow rate, so read units carefully.
Invented classroom model data: Two months each receive 40 mm of rain. In the second month, more water is taken from the river and the measured downstream flow is lower. Greater water use may help explain the lower flow. Check other changes such as storage releases, soil conditions and timing before assigning a single cause.
Bureau of Meteorology Water Data Online provides water observations. In a teacher-selected record, identify the station, dates and measurement units before discussing a pattern. Do not treat a river-height measurement as a flow rate without the appropriate information.
First Nations testing, observations and refinement (E5)Evidence and explanation
ACARA’s H01 teacher background describes First Nations Australians using observations, testing and repeated checks to develop technologies and processes. Its examples include refining stone-working processes through experience and testing. Discuss what was observed, how a prediction could be checked and how the result informed a change; do not reproduce hazardous techniques.
Use an appropriate attributed account and identify the particular People or place when the source supplies it. Different communities hold different knowledge. A student’s safe classroom model is not a historical record or an authentic reproduction of a community’s process. Follow cultural protocols and do not invent measurements, stories or claims of community endorsement.
Check: Must data come from a digital device? Answer: No. Careful observations and repeatable comparisons can provide useful data.
Important questions and answersEvidence and explanation
How do claim and evidence differ? A claim is a proposed answer; evidence is relevant observation or measurement that supports or challenges it.
What does reasoning add? It explains why the evidence supports the claim, using the relevant science idea and comparison.
Why read a method? To understand conditions and judge whether results can be compared fairly.
Can scientists change an explanation? Yes. New reliable evidence can challenge or refine it.
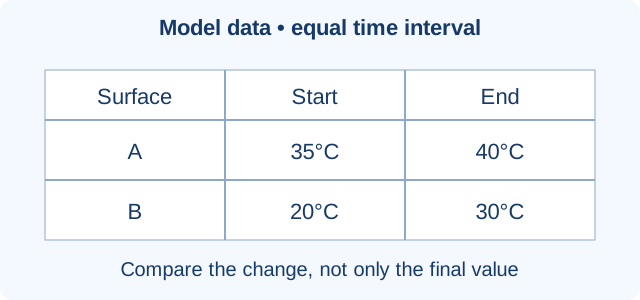
Does a higher final temperature mean faster warming? Not necessarily. Compare the change over equal time and check starting conditions.
Assessment-style questions and review hintsEvidence and explanation
A higher final temperature does not by itself show a greater rise.
Model data: Surface A starts at 35°C and ends at 40°C; surface B starts at 20°C and ends at 30°C over equal time. Which warmed more? B: it rose by 10°C, while A rose by 5°C. A ended warmer, but B’s change was larger. To compare materials fairly, control starting temperatures as well as other relevant conditions.
Model report: A team counts more butterflies after planting host vines. Does this prove planting was the only cause? No. Check repeat surveys, weather, season, search effort and other changes. If a learner treats one observation as proof, ask for an alternative explanation and a useful next observation.
A result disagrees with a prediction. What next? Keep the record, check the method and accuracy, repeat when useful, and revise the explanation if warranted. Do not erase evidence to protect a favourite claim.
Support, Core, Extend and learning boundaryEvidence and explanation
Prerequisites: read a simple table, recognise measurement units and compare amounts. Must teach: how people use relevant observations and data to construct, share, challenge and improve explanations, including the five contexts above.
Support: highlight a claim and one observation in a short model report. Core: state a cautious explanation, cite two relevant values and explain their connection. Extend: identify an alternative explanation and a further observation that could help distinguish it.
Claim–evidence–reasoning is a helpful writing scaffold, not a compulsory formula used by every scientist. Do not require formal hypothesis testing, statistical significance, complex chemistry or proof that correlation alone establishes a cause.
Exit ticket and adult evidence checkEvidence and explanation
Use two values from a provided table to support a claim.
Explain how the evidence relates to the claim and name one limitation.
Name one way another person could check or improve the explanation.
Adult review: Check values and units against the actual source; inspect the connection rather than the presence of the words claim, evidence and reasoning. Require a relevant limitation or next check. Reteach a mistaken comparison or unsupported cause before retrying. Completion alone is not mastery.
Read a repeated comparisonModel evidence
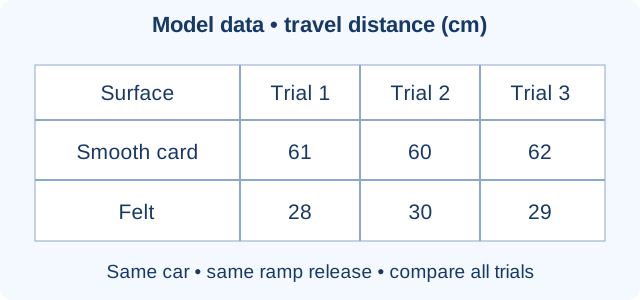
Invented classroom model data: The same car is released from the same ramp height in each trial. Compare all three records for each surface.
The car travelled farther on smooth card in every recorded trial. Repeated shorter travel on felt supports greater slowing under these conditions.
Reasoning: Friction opposes movement. The shorter travel supports an explanation involving the surface effect when the car and release are controlled. These six records do not establish a result for every car and surface.
Concept models and worked thinkingCopied topic models
Build a claim–evidence–reasoning explanation
Invented classroom model data; both surfaces start at 30°C and are measured after equal time with other conditions matched.
ClaimThe dark surface warmed faster
→
Evidence30°C to 44°C versus 30°C to 37°C in equal time
→
ReasoningThe 14°C rise is greater than the 7°C rise over equal time
A claim answers the question. Evidence is selected from observations or measurements. Reasoning explains why that evidence supports the claim and notes uncertainty or limitations.
Read both starting and final temperatures and the common time interval.
Compare the rises: 14°C and 7°C. State what happened in this test.
Explain that this is a paired comparison, not evidence that every dark object always warms faster.